Carrington Event: The 1859 Solar Storm and Where It Reached
The Carrington Event of 1859 is the benchmark solar storm. See where its aurora reached, how it compares to May 2024, and whether it could recur.

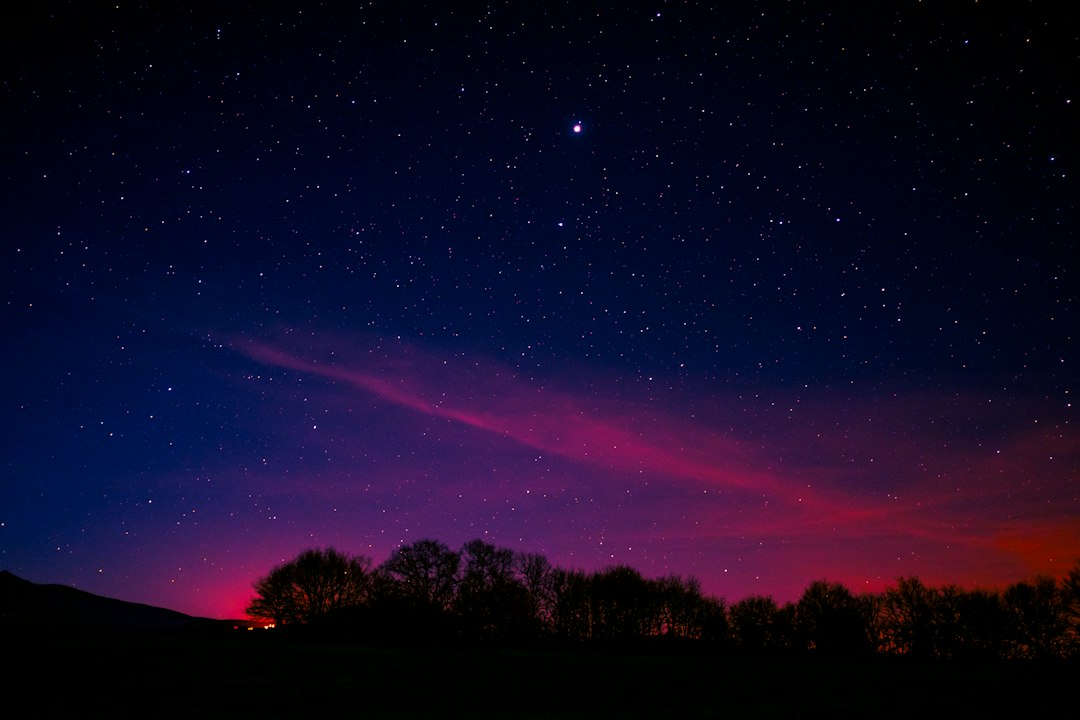
The Carrington Event was the geomagnetic storm of September 1-2, 1859, one of the most intense on record and the benchmark for extreme space weather. It began with a solar flare that the English astronomer Richard Carrington watched through his telescope, and it ended with auroras over the Caribbean, Chile and possibly Hawaii. Telegraph lines on two continents went haywire. Some operators sent messages with their batteries unplugged, running on current the storm induced in the wires.
Below are the numbers behind those stories: where the 1859 aurora reached in magnetic terms, why the Americas got the best view, how the storm stacks up against May 2024, and which cities would see it overhead if it happened tonight. If you only want to know whether tonight's sky has aurora in it, the live northern lights forecast answers that for your exact location.
Table of Contents
- What Was the Carrington Event?
- From Flare to Storm in Under a Day
- Where the Carrington Event Aurora Was Seen
- What the Storm Did to the Telegraph
- How Big Was It? Carrington vs Other Great Storms
- If It Happened Tonight, Where Would the Aurora Reach?
- How Much Warning Would We Get Today?
- Could the Carrington Event Happen Again?
What Was the Carrington Event?
The Carrington Event was a solar superstorm in which a huge flare and a fast coronal mass ejection (CME) struck Earth's magnetic field in early September 1859, during solar cycle 10. It is named after Richard Carrington, who saw the flare from his private observatory near London on the morning of September 1. Richard Hodgson saw the same flash independently from his own observatory.
| Fact | Value |
|---|---|
| Flare seen | September 1, 1859, about 11:18 GMT, lasting roughly five minutes |
| Flare size (modern scale) | About X80 (X46 to X126), from Carrington's own drawings |
| Sun-to-Earth travel time | About 17 hours to the storm's main phase (typical CMEs take several days) |
| Storm strength (Dst) | About -850 to -1,050 nT (reconstructed; no global index existed) |
| Lowest naked-eye aurora | About 20.5 to 21.8° geomagnetic latitude |
| Nights with aurora | August 28 to September 4, from two separate storms |
The flare estimate comes from a 2023 study of Carrington's original records, which measured the area of the patch he drew and his description of its brightness. That is higher than the earlier estimate of about X64 based on the magnetometer jump, and the authors judge the flare at least comparable in energy to the largest flares of the satellite era, such as the one of November 2003. A less likely alternative reading of the same records gives only about X14.
From Flare to Storm in Under a Day
The Carrington Event's main phase hit Earth roughly 17 hours after the flare, one of the fastest Sun-to-Earth crossings on record. A typical CME needs several days. This one probably had a cleared path, because an earlier eruption had already swept the space between the Sun and Earth and caused its own storm and aurora from August 28.
| Time (UT) | What happened |
|---|---|
| Aug 28, about 07:30 | First storm begins (sudden commencement in magnetograms) |
| Aug 28, from 20:30 | First aurora reports; Lisbon sees a corona aurora directly overhead |
| Sep 1, about 11:15 | Magnetometers at Greenwich and Kew jump as the flare's X-rays hit the upper atmosphere |
| Sep 1, 11:18 | Carrington sees two patches of intense white light on the Sun |
| Sep 2, before 04:20 | The CME arrives |
| Sep 2, 04:20 to 06:40 | Deepest phase of the storm in the Bombay record; auroras reach the tropics |
| Sep 2 to Sep 4 | Further aurora nights during the recovery |
The magnetometer jump at 11:15 is worth a pause. The British Geological Survey's page on the Greenwich record measures a 110 nT spike in the horizontal field at about the moment Carrington was at his eyepiece, with the caveat that the timings are approximate.
Where the Carrington Event Aurora Was Seen
The Carrington Event aurora was seen with the naked eye down to about 20.5 to 21.8° geomagnetic latitude, which put it over the Caribbean coast of Central America, Santiago in Chile, and possibly Honolulu (the date of the Hawaiian report is uncertain). Those figures come from Hayakawa and colleagues' 2019 reconstruction, which collected reports from newspapers, ship logs and observatories around the world. They place the edge of the auroral oval itself, the zone where aurora shines straight down, at about 28.5 to 30.8° invariant latitude.
The displays were bright. At Montreal on the night of August 28, Charles Smallwood described an aurora "nearly as light as when the moon is at its full," in his report to the American Journal of Science. There was no moon to help: it was new that morning.
Why the Americas got the best show
The Americas saw the Carrington Event at its peak because the storm's deepest phase landed in the middle of their night. We computed the Sun's position at each location for the middle of the 04:20 to 06:40 UT window on September 2, 1859, along with the moon:
| Place | Local time at 05:30 UT | Sun altitude | Sky |
|---|---|---|---|
| Boston | about 00:50 | -38° | Full night, moon down |
| Havana | about 00:00 | -59° | Full night, moon down |
| Caribbean coast, Nicaragua | about 23:55 | -70° | Full night, moon down |
| Santiago, Chile | about 00:50 | -62° | Full night, moon down |
| San Francisco | about 21:20 | -31° | Full night, moon down |
| Honolulu | about 19:00 | -10° | Dusk, dark by 06:40 UT; moon up |
| Lisbon | about 04:55 | -8° | Dawn twilight; sunrise about 06:06 UT |
| London | about 05:30 | +2° | Sun up |
| Tokyo | about 14:50 | +43° | Afternoon |
Local mean solar time; time zones did not exist yet. Sun and moon positions computed with the PyEphem library.
Every factor that decides whether you see an aurora lined up for the Americas. Activity was extreme. It was the dead of night. The moon, 31% lit, had set everywhere from Boston to Santiago. And there was no electric light anywhere on Earth. Europe got a strong show on August 28, but on September 2 the storm peaked into its sunrise.
Two things carry over to any storm today. First, the strongest hours arrive on the Sun's schedule, not yours, so half the planet usually misses the peak. Our solar storm guide measured this for modern storms: only 29 to 43% of strong-storm hours fell in darkness at the five cities checked. Second, low-latitude aurora during a great storm is mostly red, from oxygen high in the atmosphere. Our page on aurora colors explains why red dominates far from the pole.
What the Storm Did to the Telegraph
The 1859 storms induced electric currents in telegraph lines strong enough to shock operators, throw sparks that scorched or set fire to equipment, and run some lines without batteries. Wires stretched over hundreds of miles of ground act like an antenna for a fast-changing magnetic field. In 1859 the telegraph was the only long conductor most countries had.
The best documented case is from the morning of September 2. According to George Prescott's report in the American Journal of Science, the American Telegraph Company's Boston office found its wires so affected by "the auroral current" when business began at 8 a.m. that little could be sent. Boston and Portland, Maine, cut off their batteries and worked the line on the storm's current alone for about two hours. "Much better than with the batteries on," Portland replied. That morning in Baltimore, a telegraph superintendent reported sparks strong enough "to set on fire the wood work of the switch board." During the first storm, on the evening of August 28, Washington operator Frederick Royce was stunned by "a very severe electric shock" when his forehead grazed a ground wire.
Note the timing on September 2: morning in Boston, in full daylight. Ground currents do not care whether it is dark. Aurora does. A storm can wreck equipment on the day side of the planet while only the night side gets anything to look at.
How Big Was It? Carrington vs Other Great Storms
The Carrington Event remains the benchmark storm, but reconstructions put the 1872 and 1921 storms in the same class, and May 2024 pushed the visible aurora within a few degrees of 1859's reach. The usual yardstick is Dst, a measure of how much a storm weakens Earth's magnetic field at low latitudes, in nanoteslas (nT). More negative means stronger.
| Storm | Peak Dst (nT) | Highest Kp | Naked-eye aurora reached (geomag. lat.) |
|---|---|---|---|
| September 1859 | about -850 to -1,050 (est.) | none yet | 20.5 to 21.8° |
| February 1872 | below -830 (est.) | none yet | 18.7° |
| May 1921 | -907 ± 132 | none yet | 16.2° |
| August 1972 | -125 | 9o | not reconstructed |
| March 1989 (Quebec) | -589 | 9o | 29° |
| May 2024 | -412 (provisional) | 9o | 23.2° (south), 24.3° (north) |
Sources: Hayakawa et al. 2019 Table 1 and the 2025 study of the May 2024 storm; Dst for 1972 and 1989 from the Kyoto World Data Center; Kp from GFZ Potsdam. The 1872 limit could be as low as 10° if a doubtful report from Bombay is counted.
Two things jump out. May 2024 was less than half the storm by Dst, yet its naked-eye aurora reached Namibia and an observatory in India (low on the horizon there), close to the 1859 limit. And August 1972 hit the very top of the Kp scale with only a moderate Dst.
The Kp scale cannot tell these storms apart
Kp stops at 9. We counted every three-hour value in GFZ Potsdam's Kp record, which starts in 1932. Kp has reached its ceiling of 9o in just 31 three-hour blocks on 27 days, most recently May 11, 2024. The 1972 storm, the 1989 Quebec blackout and May 2024 all hit that same 9o. A Carrington-class storm would read 9 too.
That matters if you watch aurora apps. Every Kp-based forecast, including ours, treats a Kp 9 storm as maxed out on activity, whether it is a May 2024 or an 1859. Our explainer on the Kp index covers what the number can and cannot tell you.
If It Happened Tonight, Where Would the Aurora Reach?
A Carrington Event tonight would put aurora overhead across the contiguous United States, most of Europe and southern Australia, and show it to the naked eye in places like Mexico City, Puerto Rico and Tokyo. To work this out, we computed each city's geomagnetic latitude today and compared it with the 1859 limits above. We used a simple tilted dipole with the geomagnetic pole at 80.8°N, 72.6°W, the same approach and pole the May 2024 study used, so the numbers compare directly with its limits. The 1859 study used the same dipole idea with the historical field of the time.
| City | Geomagnetic latitude (2025) | A Carrington-class aurora would be... |
|---|---|---|
| Anchorage | 61.9° | Overhead, filling the sky |
| Seattle | 53.0° | Overhead, filling the sky |
| London | 53.4° | Overhead, filling the sky |
| Boston | 51.6° | Overhead, filling the sky |
| New York | 49.9° | Overhead, filling the sky |
| Los Angeles | 40.2° | Overhead at the peak |
| Sydney | -40.2° | Overhead at the peak |
| Houston | 38.2° | Overhead at the peak |
| Miami | 34.9° | Overhead at the peak |
| Havana | 32.2° | Overhead at the peak |
| Beijing | 30.8° | High in the northern sky |
| Tokyo | 27.8° | Visible in the northern sky |
| Mexico City | 27.6° | Visible in the northern sky |
| San Juan, PR | 27.6° | Visible in the northern sky |
| Santiago | -24.3° | Low in the southern sky |
| Shanghai | 22.3° | A low glow at best |
| Honolulu | 21.8° | At the 1859 limit |
| Hong Kong | 13.2° | Out of reach (even 1872 stopped at 18.7°) |
"Overhead" means poleward of the 1859 oval edge (about 31°). Cities between that edge and the 22° naked-eye limit would see it toward the pole.
The southern rows work the same way, facing south. Our aurora australis guide covers where the southern lights show up in ordinary storms.
A dipole is a simplification of Earth's real field, so treat each row as approximate by a few degrees, especially in Europe, where more detailed field models give lower magnetic latitudes.
The planet has also shifted under the storm. Earth's magnetic field has drifted since 1859, so the same storm lands differently today. Honolulu was at 20.5° geomagnetic latitude in 1859 and is at 21.8° now. The Caribbean coast of Nicaragua was at 23.1° then and is at about 20.5° now. Central America has slipped toward the magnetic equator, while Hawaii and northern Asia have moved slightly away from it.
What you would actually see
The 1859 accounts come from a world without streetlights. Today, a low-latitude storm aurora over a city often shows up better on a phone than to the eye. In May 2024, cameras recorded aurora at sites where observers saw nothing with the naked eye, such as in Guatemala. During a great storm, get out of town, face the pole, and take a photo even if the sky looks only faintly pink. Our aurora photography guide has settings for exactly that.
Clouds and the moon still decide the night. That is what the northern lights forecast is built around: activity, clouds, darkness and sky brightness combined into one verdict for your location. For mid-latitude spots that already see aurora in ordinary strong storms, such as Seattle or the UK, a Carrington-class storm would be a once-in-a-lifetime night overhead.
How Much Warning Would We Get Today?
A modern Carrington Event would give less than a day of warning from the eruption, and only about 10 minutes of certainty about how hard it will hit. The flare's light arrives in about eight minutes. Coronagraphs then image the CME leaving the Sun; NOAA says imagery from its new SOLAR-1 spacecraft reaches forecasters within 30 minutes. That is enough to issue a storm watch for the next day.
The key detail stays hidden until the very end. A storm's strength depends heavily on whether the CME's magnetic field points south, opposite to Earth's. That only becomes measurable when the cloud passes the monitors at the L1 point, about 1.5 million km upstream. At the Carrington Event's average speed of roughly 2,400 km/s (about 150 million km in 17 hours), that is about 10 minutes before impact. NOAA's SOLAR-1, which finished commissioning in mid-2026, carries magnetometers that measure the incoming field's direction, with data available within about five minutes.
For grid operators, a watch of most of a day means time to reduce load on vulnerable transformers. For skywatchers, it means you would know most of a day ahead to plan, but not until the evening whether it pays off. Our guide to what causes the northern lights explains why the CME's magnetic direction matters so much.
Could the Carrington Event Happen Again?
Almost certainly, though nobody can say when. Published estimates of the odds of a Carrington-class storm in a given decade range from under 1% to about 12%. The spread comes from having very few storms that size to fit a curve to, and from the choice of statistical model.
| Study | Odds of a Carrington-class storm per decade |
|---|---|
| Riley, 2012 (as reported by NASA) | About 12% |
| Riley and Love, 2017, power-law model | 10.3% (95% CI 0.9% to 18.7%) |
| Riley and Love, 2017, lognormal model | 3.0% (95% CI 0.6% to 9.0%) |
| Moriña et al., 2019 | 0.46% to 1.88% (95% confidence) |
The same 2017 data gave 10.3% under one model and 3.0% under another. Riley and Love added that if solar activity keeps declining, their figures may be upper limits rather than best estimates. That is the uncertainty in one paragraph.
We have also had a near miss. On July 23, 2012, a CME that University of Colorado physicist Daniel Baker judged "in all respects at least as strong as the 1859 Carrington event" tore through Earth's orbit and hit NASA's STEREO-A spacecraft instead. "If the eruption had occurred only one week earlier, Earth would have been in the line of fire," Baker told NASA. You can watch the model of the 2012 CME that missed Earth from NASA's visualization studio.
What it would cost
The cost would be counted in power grids and satellites. A 2013 Lloyd's report modeled a Carrington-level storm hitting the North American grid and estimated 20 to 40 million people in the U.S. at risk of outages lasting from 16 days to one or two years, at a total economic cost of $0.6 to $2.6 trillion. The length depends largely on the availability of spare high-voltage transformers. It is a scenario estimate, not a forecast.
The Bottom Line on 1859
The Carrington Event was not a one-off. It was the best-documented member of a small family of great storms, along with 1872, 1921 and the near miss of 2012, and May 2024 showed that the aurora can get within a few degrees of 1859's reach on a storm less than half the size. The storm decides how far the aurora reaches, but your clock, your clouds and your moon decide whether you see it. When the next big one comes, check the live aurora forecast for your location before you head out.
More Articles
Solar Storm Northern Lights: Will the Storm Reach Your Sky?
Solar storm northern lights alerts are a gamble on timing. Cycle 25 data shows how often a storm's peak lands on your night, and what to do when one hits.
The Kp Index, Explained: Why the Aurora Number Is Not a Promise
The kp index is a 0 to 9 scale of geomagnetic activity. Here is what the aurora number really means, and why a high value is no promise.
What Causes the Northern Lights? The Science Behind the Aurora Borealis
What causes the northern lights? The sun sends charged particles that hit our atmosphere near the poles. The full science, in plain English.